Using RSI in Crypto Trading
The Relative Strength Index (RSI) is one of the most widely used momentum indicators in cryptocurrency trading. It helps traders evaluate whether a digital asset is overbought or oversold, offering clues about potential trend reversals or continuation patterns.
Unlike complex trading systems that require multiple overlays and signals, RSI is straightforward. It measures the speed and magnitude of recent price changes and translates that information into a value between 0 and 100. When used properly, it becomes a practical decision-making tool rather than just another chart indicator.
What Is RSI?
The Relative Strength Index was developed by J. Welles Wilder Jr. and is classified as a momentum oscillator. Its core purpose is to identify price conditions that may signal exhaustion in buying or selling pressure.
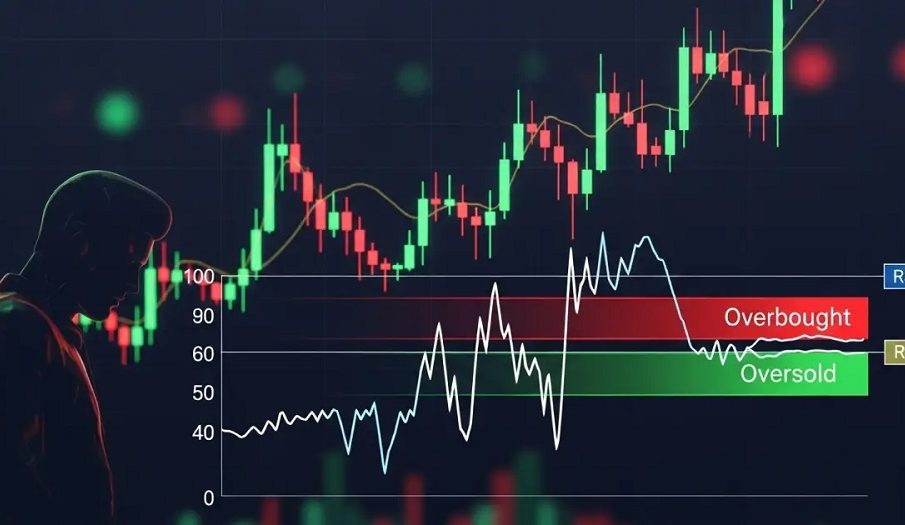
RSI operates on a scale from 0 to 100:
-
Above 70 → Typically considered overbought
-
Below 30 → Typically considered oversold
-
Around 50 → Indicates neutral momentum
In crypto markets, which are known for volatility, some traders adjust these thresholds to 80/20 during strong trends to avoid false signals.
Why RSI Works Well in Crypto Markets
Cryptocurrency markets often experience rapid price swings driven by sentiment, liquidity shifts, and macro events. RSI adapts well to these conditions because:
-
It reacts quickly to momentum changes
-
It highlights potential reversal zones
-
It works across multiple timeframes
-
It complements other technical tools
However, RSI is not a standalone solution. It performs best when combined with trend analysis, volume indicators, or support and resistance levels.
How RSI Is Calculated
RSI is derived from the average gains and losses over a specified period—commonly 14 periods. The formula compares the magnitude of recent gains to recent losses to determine relative strength.
While most trading platforms calculate RSI automatically, understanding the logic behind it helps traders interpret signals more effectively. A rising RSI suggests increasing bullish momentum, while a declining RSI indicates strengthening bearish pressure.
Core RSI Trading Strategies
1. Overbought and Oversold Strategy
This is the most basic and commonly used RSI approach.
Trading concept:
-
Buy when RSI falls below 30 and begins turning upward
-
Sell when RSI rises above 70 and starts turning downward
This method works best in range-bound markets. During strong trends, RSI may remain overbought or oversold for extended periods, which can mislead traders.
2. RSI Divergence Strategy
Divergence occurs when price action and RSI move in opposite directions.
Types of divergence:
-
Bullish divergence → Price makes lower lows, RSI makes higher lows
-
Bearish divergence → Price makes higher highs, RSI makes lower highs
Divergence often signals weakening momentum and potential trend reversal. In crypto trading, this setup is particularly useful near major support or resistance zones.
3. RSI Trend Confirmation
Instead of looking for reversals, RSI can confirm ongoing trends.
-
RSI consistently above 50 → Bullish bias
-
RSI consistently below 50 → Bearish bias
During strong uptrends, RSI typically fluctuates between 40 and 80. In downtrends, it often stays between 20 and 60. Recognizing these patterns helps avoid premature counter-trend trades.
4. RSI Swing Rejection
Swing rejection is a more advanced strategy involving specific RSI behavior:
Bullish swing rejection steps:
-
RSI drops below 30
-
RSI rises back above 30
-
RSI pulls back but stays above 30
-
RSI breaks its previous high
This pattern indicates strengthening upward momentum without price needing to form a new low.
Choosing the Right Timeframe
RSI works across all timeframes, but the reliability varies:
-
1-minute to 15-minute charts → Suitable for scalping
-
1-hour to 4-hour charts → Balanced for intraday trading
-
Daily charts → Better for swing traders
Shorter timeframes produce more signals but also more noise. Longer timeframes offer fewer but often stronger setups.
Common Mistakes When Using RSI
Even though RSI is simple, misuse is common. Key mistakes include:
-
Treating overbought as an automatic sell signal
-
Ignoring the broader market trend
-
Using RSI without confirming price structure
-
Overtrading based on minor RSI fluctuations
In trending crypto markets, RSI can remain overbought for extended periods. Selling too early may result in missed gains.
Combining RSI with Other Indicators
To improve accuracy, many traders combine RSI with:
-
Moving averages for trend direction
-
Volume indicators for confirmation
-
Bollinger Bands for volatility context
-
Support and resistance zones for entry timing
RSI is strongest when used as a confirmation tool rather than a sole trigger.
Risk Management with RSI
No indicator eliminates risk. Effective crypto trading requires disciplined risk management.
Key principles include:
-
Setting stop-loss levels before entering a trade
-
Avoiding oversized positions
-
Maintaining a favorable risk-to-reward ratio
-
Avoiding emotional decisions after false signals
RSI can improve timing, but capital preservation ensures long-term survival.
When RSI May Fail
RSI is less reliable in:
-
Strong breakout trends
-
News-driven price spikes
-
Low-liquidity tokens
-
Sudden macroeconomic events
In such cases, price can move aggressively while RSI lags behind. Recognizing market context is essential.
Practical Example of RSI in Action
Imagine Bitcoin trading in a sideways range. RSI drops below 30 near a known support level, then begins to climb. Volume increases, and price forms a bullish candlestick pattern. This combination strengthens the probability of a bounce.
Contrast that with a strong uptrend where RSI moves above 70 but price continues rising steadily. Selling solely because RSI is overbought would likely be premature.
The difference lies in understanding context rather than reacting mechanically.
Final Thoughts
RSI remains one of the most reliable and accessible tools in crypto trading. Its simplicity makes it attractive to beginners, while its depth allows advanced traders to build nuanced strategies.
Success with RSI depends on interpretation rather than blind rule-following. When paired with market structure analysis and disciplined risk management, it can significantly enhance trade timing and confidence.
Frequently Asked Questions (FAQ)
1. Is RSI better for day trading or swing trading crypto?
RSI works for both styles. Day traders often use shorter timeframes like 5-minute or 15-minute charts, while swing traders prefer 4-hour or daily charts for stronger signals.
2. Can RSI predict market crashes in crypto?
RSI does not predict crashes directly. However, bearish divergence and prolonged overbought conditions may indicate weakening momentum before significant pullbacks.
3. What RSI settings are best for cryptocurrency?
The default 14-period setting works well for most traders. Some shorten it to 7 for faster signals or extend it to 21 for smoother readings.
4. Should RSI be used alone?
It is not recommended. RSI performs better when combined with trend indicators, support/resistance analysis, and volume confirmation.
5. Why does RSI stay overbought during bull markets?
Strong trends create sustained buying pressure. RSI reflects momentum, so it can remain elevated as long as demand remains strong.
6. How reliable is RSI divergence in crypto?
Divergence can be powerful, especially on higher timeframes. However, confirmation from price action and volume improves reliability.
7. Does RSI work for all cryptocurrencies?
RSI works best on highly liquid assets like Bitcoin and Ethereum. Low-liquidity tokens may produce erratic signals due to sudden price swings.